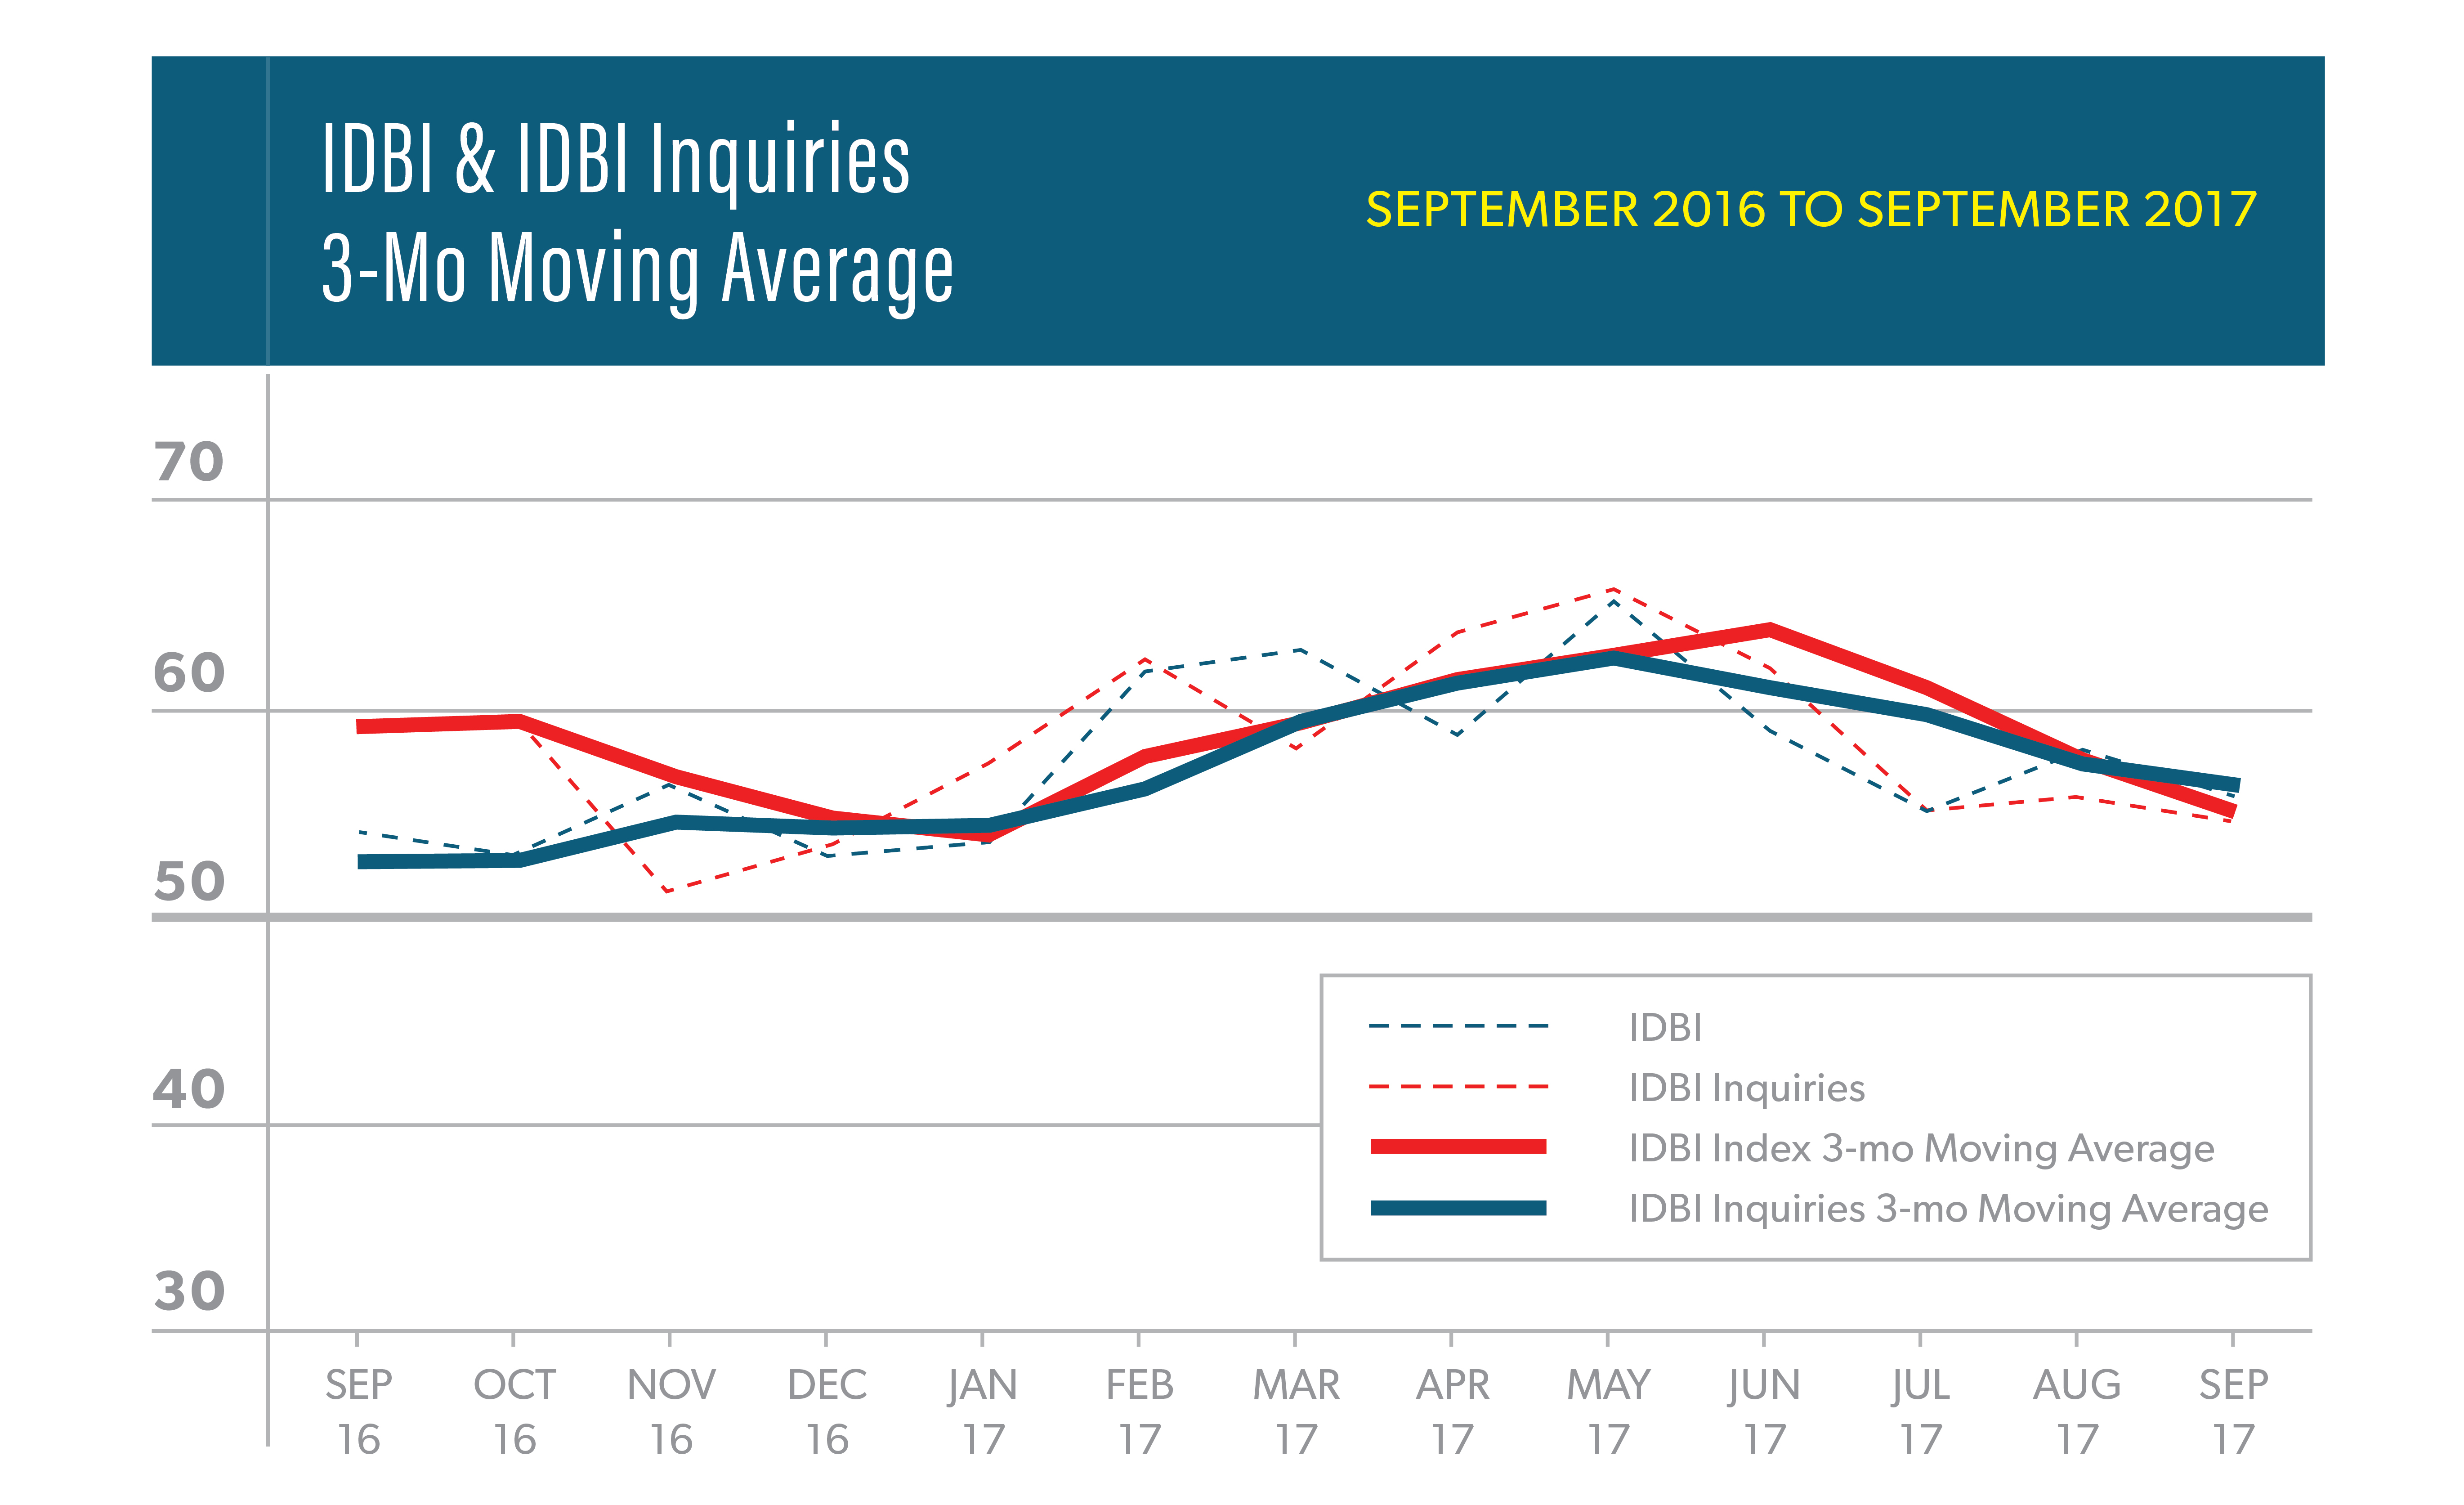
The American Society of Interior Designers’ (ASID) Interior Design Billings Index (IDBI) dipped slightly in September to a score of 55.6 from a score of 58.0 in August. IDBI scores above 50 indicate expansion in the industry, while scores below 50 denote contraction. For the last consecutive 21 months, firms have recorded an increase or no decrease in design services compared to the previous month. The inquiries index, a leading indicator for billings, was essentially unchanged in September with a small dip to a sore of 54.3. Both indices, billings and inquiries, were slightly below their three-month moving average.
The West was the only region to report an IDBI score below 50 in September. Scores for this region over the last six months have been strong, so business conditions remain healthy. Panelists continue to be optimistic about the future as the six-month expectations index remains elevated at a score of 58.6.
“Despite slightly lower readings, these results indicate solid growth for the interior design industry in the coming months,” said Jack Kleinhenz, Ph.D., CBE, ASID economist. The overall economy softened during the third quarter due in part to the hurricanes in Texas and Florida. Lost activity will be made up in future months and should show a rebound in those areas as damaged homes are repaired or replaced.
September’s special question asked survey panelists, “What percentage of your clients have requested or agreed to employ sustainable or green design in their projects in the past quarter?” We asked this same question in November 2015. Better than one in three (35%) respondents reported that at least some of their clients asked about or agreed to sustainable/green design in the past quarter, essentially the same percentage as in 2015. Of respondents, 28% indicated that all of their green projects were residential. The same proportion indicated that all of their green projects were non-residential. The even balance reported between residential and non-residential green projects is the primary difference between the responses to this question in 2015 and 2017. In 2015, over half of the respondents (52%) reported that all of their green projects were residential, while only 2% of respondents reported that all of their green projects were non-residential.